
Aluminium Conductivity Thermal Vs Temperature: k–T Tables That Work

Start With Clear Definitions And Scope
What aluminium conductivity thermal really means
Ever wondered why aluminum is such a popular choice when heat management is critical? The answer lies in its thermal conductivity—a property that tells you how quickly and efficiently heat moves through the material. When engineers talk about aluminium conductivity thermal, they’re referring to the material’s intrinsic ability to transfer heat across a temperature gradient, regardless of its shape or size. This isn’t just a technical detail; it’s the backbone of how aluminum is used in heat exchangers, electronics cooling, and countless industrial applications.
But don’t confuse thermal conductivity with other heat-related properties. Here’s a quick breakdown to clarify:
- Thermal conductivity (k): How well a material itself conducts heat, measured in W/m·K (watts per meter per kelvin).
- Thermal conductance (C): The total heat flow through a specific object, which depends on both the material and its geometry.
- Heat transfer coefficient (h): Describes heat transfer between a solid surface and a fluid, measured in W/m²·K.
- Thermal diffusivity (α): How quickly a material responds to temperature changes, measured in m²/s. (You’ll often see this in discussions about thermal diffusivity units.)
Units and symbols engineers actually use
To keep things clear and consistent, engineers rely on standard symbols and units. Here’s a handy table for quick reference:
| Symbol | Property Name | Typical Units |
|---|---|---|
| k | Thermal conductivity | W/m·K |
| C | Thermal conductance | W/K |
| h | Heat transfer coefficient | W/m²·K |
| α | Thermal diffusivity | m²/s |
So, when you see units of thermal conductivity or thermal conductivity units in technical documentation, you’ll know exactly what they mean: W/m·K is the most widely accepted measure for comparing materials like aluminum.
Compare k at the same temperature, alloy, and temper to avoid apples-to-oranges.
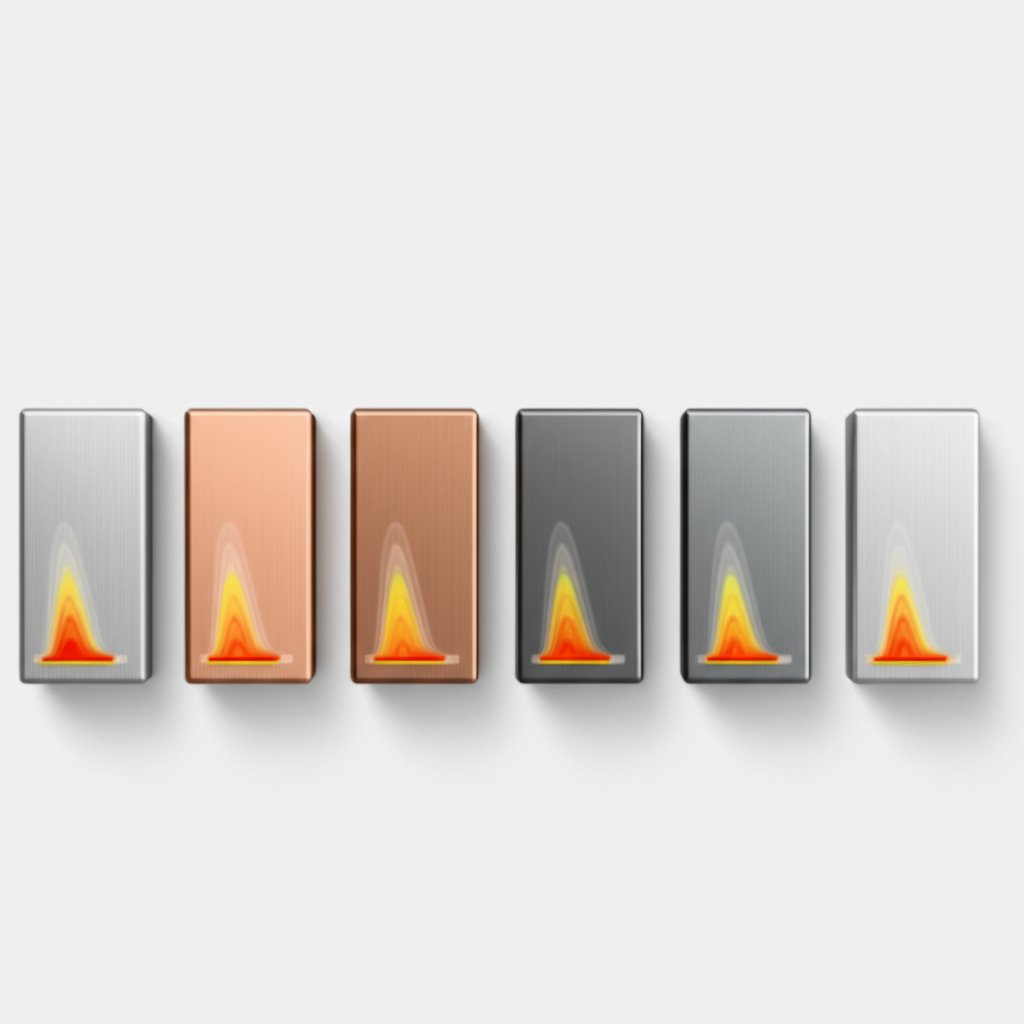
Why aluminum is a go-to thermal conductor
Aluminum stands out because it offers a rare combination of high thermal conductivity, low density, and excellent corrosion resistance. Imagine you’re designing a heat sink for electronics—aluminum’s high k-to-weight ratio means you can move heat efficiently without adding unnecessary mass. Its easy manufacturability and natural oxide layer (for corrosion protection) make it a favorite in industries from aerospace to consumer electronics.
But here’s a word of caution: not all aluminum is created equal. The thermal conductivity of aluminum can vary significantly depending on whether you’re dealing with pure metal or an alloy. Even within a single alloy, properties shift with changes in temper (heat treatment) and operating temperature. For example, the k value for pure aluminum at room temperature is different from that of a 6000-series alloy at elevated temperatures (Engineering Toolbox).
Whenever you see a specific k value, always check the source, temperature, alloy composition, and temper. If you’re quoting numbers, cite a primary reference. Otherwise, focus on the concepts and trends rather than single-point values.
Finally, keep in mind: measured k values for aluminum are influenced by microstructure, impurities, and temperature. That means context is everything—always specify the measurement conditions in any technical report or comparison.
How Aluminum Compares To Other Thermal Metals
Aluminum versus copper in heat spreading
When choosing a metal for heat management, have you ever wondered why copper and aluminum are so often compared? The answer is in their thermal pathways. Both metals conduct heat through a combination of electrons and atomic vibrations (phonons), but copper’s electron mobility gives it a distinct edge in pure conductivity. According to industry data, copper’s thermal conductivity is about 401 W/m·K, while aluminum’s is around 235 W/m·K at room temperature. This means copper moves heat faster, making it the top pick for applications where maximum heat dissipation is essential—think high-performance electronics or cookware bases.
But that’s not the whole story. Aluminum’s lower density means it delivers a strong k-to-weight ratio, so for weight-sensitive systems—like automotive heat exchangers or aerospace radiators—aluminum often wins out. The trade-off between thermal conductivity copper vs aluminum is not just about numbers; it’s about what matters for your design: speed of heat transfer, weight, and cost.
Where stainless steel and titanium fit
Stainless steel and titanium are a different story. Their atomic structures and alloying elements slow down both electrons and phonons, resulting in much lower thermal conductivity. For example, the thermal conductivity of stainless steel 304 is around 16.2 W/m·K at room temperature, and titanium (grade 2) is similar at 16.4 W/m·K (SteelPRO Group). That’s an order of magnitude lower than aluminum or copper. Why use these metals at all? Their strength, corrosion resistance, and ability to maintain temperature stability make them ideal for structural components, insulation, or chemical processing equipment where minimizing heat transfer or withstanding harsh environments is more important than maximizing heat flow.
| Material | Thermal Conductivity k (W/m·K) | Density (g/cm³) | Corrosion Behavior | Formability | Typical Applications | Temperature (°C) | Source |
|---|---|---|---|---|---|---|---|
| Copper | 401 | 8.96 | Good, but oxidizes | Good | Electronics, cookware, HVAC | ~20 | Markham Metals |
| Aluminum | 235 | 2.70 | Excellent | Excellent | Heat exchangers, automotive, electronics | ~20 | SteelPRO Group |
| Stainless Steel 304 | 16.2 | 7.90 | Outstanding | Good | Food processing, piping, architecture | ~20 | SteelPRO Group |
| Titanium (Grade 2) | 16.4 | 4.51 | Excellent | Moderate | Aerospace, medical devices, chemical equipment | ~20 | SteelPRO Group |
Balancing conductivity, mass, and cost
So, when does aluminum outperform copper? And when is it the wrong choice? Here’s a quick rundown:
- Aluminum excels in weight-sensitive applications and where ease of fabrication or corrosion resistance is a priority.
- Copper is favored where the highest heat transfer rate is critical (e.g., compact heat sinks, premium cookware).
- Stainless steel and titanium are chosen for their durability, corrosion resistance, and low stainless steel heat conductivity in demanding environments.
Choose the material that meets your thermal conductivity (k) targets with the lowest system cost at the required temperature—not the one with the absolute highest k.
Understanding these trade-offs helps you navigate the real-world constraints of budget, weight, manufacturability, and performance. In the next section, we’ll explore why high thermal conductivity isn’t always the only property that matters—specific heat plays a key role in transient and steady-state thermal design.
Specific Heat And Conductivity Are Not The Same
Specific heat versus conductivity in design
When you’re designing with aluminum, do you ever wonder why some parts heat up quickly while others seem to resist temperature changes? The answer comes down to two distinct properties: thermal conductivity and specific heat capacity. They both influence how your component handles heat, but in very different ways.
- Thermal conductivity (k): Measures how fast heat can move through a material. High k means heat flows quickly from hot to cold regions.
- Specific heat capacity (cp): Tells you how much energy is needed to raise the temperature of a unit mass by one degree (typically given as J/kg·K). Higher cp means the material can absorb more heat before its temperature rises.
In practical terms, the thermal conductivity of aluminum helps it spread heat efficiently—think of a heat sink rapidly moving heat away from a processor. Meanwhile, the specific heat of aluminum determines how much energy it takes to warm up an aluminum plate in an oven or how quickly it cools after removing a heat source.
Transient thermal behavior in aluminum parts
Imagine you’re heating two blocks—one of aluminum, one of stainless steel. If both blocks receive the same amount of heat, the aluminum block will not only spread the heat faster (thanks to higher k), but it will also warm up more quickly if its specific heat is lower than the other material’s. However, compared to water (which has a much higher specific heat), aluminum heats up and cools down rapidly—a reason why metal cookware responds so quickly on the stove.
For aluminum at room temperature, the specific heat of aluminum j/kg k is about 897 J/kg·K, according to widely referenced specific heat charts. This value means it takes 897 joules to raise one kilogram of aluminum by one kelvin—information that’s critical when predicting warm-up times or designing for thermal stability.
| Property | Symbol | Typical units | Role in design |
|---|---|---|---|
| Thermal conductivity | k | W/m·K | Controls heat spreading and gradients |
| Specific heat capacity | cp | J/kg·K | Impacts warm-up/cool-down rate and energy storage |
When capacity outweighs conductivity
Sometimes, you’ll want a material that doesn’t just move heat, but also resists temperature swings. For example, in thermal mass walls or heat sinks designed to buffer temperature spikes, a higher specific heat capacity of aluminium can help maintain more stable conditions. This is why both k and cp appear in thermal models and why referencing a reliable specific heat chart is essential for accurate engineering predictions.
High k reduces temperature gradients; high specific heat reduces temperature rise for a given heat input.
Remember: always specify the temperature and alloy when quoting specific heat values, as these can shift with both composition and temperature. Understanding the interplay between aluminium conductivity thermal and heat capacity will prepare you for the next step—exploring how alloying and processing further influence these thermal properties.

Alloy And Microstructure Effects On Heat Conduction
How alloy chemistry and temper influence k
Ever wondered why the aluminium conductivity thermal value you see in datasheets can swing so widely between alloys or even between batches? It all comes down to chemistry and processing. When you add elements like silicon, magnesium, or copper to aluminum, you’re not just boosting strength or corrosion resistance—you’re also changing how well heat moves through the metal. These solute atoms and their precipitates disrupt the free flow of electrons and phonons, which are the main carriers of heat in metals. The result: each new alloying element or phase can lower the overall al thermal conductivity compared to pure aluminum.
Take the popular 6xxx series as an example. Aluminum 6061 T6—widely used in heat exchangers and structural parts—has a typical thermal conductivity of aluminum 6061 t6 around 152 W/m·K at room temperature. This is noticeably lower than pure aluminum (often cited near 235 W/m·K), but it’s a tradeoff for the added strength and manufacturability you get from the alloying process. Even within a single alloy, the 6061 thermal conductivity will shift depending on how the material is heat-treated. For instance, the T6 temper (solution-treated and artificially aged) optimizes strength, while the O temper (annealed) yields lower strength but can slightly increase aluminium heat conductivity due to reduced solute content in solid solution (Wikipedia: 6061 Aluminium Alloy).
Microstructure levers that raise or lower conductivity
Sounds complex? Let’s break it down. The microstructure of aluminum alloys—grain size, precipitate distribution, dislocations, and porosity—acts like a network of highways and roadblocks for heat flow. Large, clean grains with minimal boundaries let heat zip through more easily. In contrast, fine grains, lots of precipitates, or high dislocation density (from cold work or deformation) scatter electrons and phonons, reducing conductivity.
For example, annealing (a heat treatment that softens the alloy and allows grains to grow) can increase the thermal conductivity by reducing dislocation density and allowing solute atoms to precipitate out of solid solution. Conversely, cold working (rolling, stamping, or drawing) introduces more dislocations and can lower k. The same logic applies to inclusions—iron, manganese, and chromium phases, or even trapped gas porosity from casting or certain additive manufacturing (AM) processes, all serve as obstacles to smooth heat flow (Thermal Conductivity of Aluminum Alloys - A Review).
AM aluminum parts and thermal pathways
With the rise of additive manufacturing, you might wonder: does 3D printing change the game for conductivity of aluminum? It can. AM processes often introduce microstructural anisotropy (directional grain growth), residual stresses, and higher levels of porosity compared to wrought or cast products. These factors can significantly reduce the effective thermal conductivity. However, targeted post-processing—like hot isostatic pressing (HIP) or tailored heat treatments—can help close pores, relax stresses, and partially restore the thermal performance of AM parts.
| Alloy/Temper | Relative k trend | Strength class | Corrosion behavior | Formability | Notes on measurement temperature | Source/Method |
|---|---|---|---|---|---|---|
| 6061-T6 | Single-point (typ. 152 W/m·K at 25°C) | High | Good | Excellent | Room temp; k drops with more alloying | PartMFG |
| 6061-O (annealed) | Range (slightly higher than T6) | Low | Good | Excellent | Room temp; annealing increases k | Wikipedia |
| AM 6061 (as-built) | Range (lower than wrought) | Varies | Good | Good | Depends on porosity, post-processing | PubMed |
| AM 6061 (HIP/heat treated) | Range (can approach wrought) | Varies | Good | Good | Improved after HIP/anneal | PubMed |
- Minimize solute content for higher k (choose purer alloys or tempers with less solute in solid solution)
- Reduce porosity and inclusions (especially in AM or cast parts)
- Consider annealing or solution/aging heat treatments per datasheet recommendations
- Always document the alloy, temper, and processing history when reporting or specifying k
Reported thermal conductivity (k) must always be linked to alloy composition, heat treatment, and temperature to be reproducible and meaningful for engineering design.
Now that you understand how microstructure and processing shape the thermal conductivity of 6061 and other alloys, the next step is knowing how to measure k reliably—and report it with the right context for your application.
How To Measure Aluminum Thermal Conductivity Reliably
Choosing a method for aluminum samples
When you need to quantify aluminium conductivity thermal for a new alloy or component, it’s tempting to grab a single value from a datasheet. But real-world performance depends on how, where, and with what method you measure. Sounds complex? Let’s break it down. There are several proven techniques for measuring the thermal conductivity unit (W/m·K) of aluminum, each with its own strengths and limitations. The most common lab-scale methods include the steady-state bar, guarded hot plate, and transient techniques (like laser-flash or transient plane source). Choosing the right method depends on your sample’s geometry, temperature range, and the level of uncertainty you can tolerate.
| Method | Sample type/size | Temperature capability | Key assumptions | Strengths | Limitations | Calibration needs |
|---|---|---|---|---|---|---|
| Steady-State Bar | Long bars, uniform cross-section | Broad (room temp to 800°C+) | 1D heat flow, good insulation | Direct, simple (classic thermal conductivity formula) |
Slow, sensitive to heat losses | Reference materials, loss corrections |
| Guarded Hot Plate | Flat slabs, large area | Typically up to 500°C | Steady-state, uniform contact | Good for bulk conductivity of sheets | Contact resistance, edge losses | Surface prep, reference checks |
| Transient Laser-Flash | Small discs/thin slabs | Wide (ambient to 1000°C+) | Homogeneous, isotropic sample | Fast, covers wide temps, small samples | Needs density & specific heat, surface prep | Calibration with standards, emissivity checks |
| Transient Plane/Line Source | Solids, powders, pastes | -50°C to 300°C (typical) | Good contact, uniform heating | Quick, flexible, direct heat conductivity units | Contact resistance, not for high anisotropy | Sensor calibration, reference runs |
For most aluminum alloys, transient laser-flash and plane source methods are preferred for their speed, flexibility, and ability to cover a wide temperature range. However, steady-state methods remain the gold standard when you need the lowest uncertainty and direct measurement of bulk conductivity (C-Therm).
Standardized protocol for k measurements
Ready to get reliable results? Here’s a step-by-step protocol you can adapt to your own lab or R&D workflow:
- Specify alloy, temper, density, and surface roughness—document these details before you start. Aluminum’s k value is sensitive to composition and processing.
- Machine coupons to controlled dimensions and flatness—ensure tight tolerances to minimize geometric uncertainty.
- Calibrate sensors and verify heat losses—use reference samples and run blanks to check for systematic errors.
- Run pre-tests at known references—validate your setup with materials of known thermal conductivity unit of measure (W/m·K).
- Record environment and temperature—log ambient conditions, sample temperature, and any thermal gradients.
- Repeat for reproducibility—conduct at least three runs to check for consistency.
- Report k with method, temperature, and uncertainty—always note the thermal conductivity equation or analysis used, and cite reference standards for traceability.
This protocol is designed to ensure your measured k values are credible, repeatable, and comparable across labs and projects.
Reporting uncertainty and repeatability
Even the best labs face uncertainty. To help you build confidence in your measurements, here’s a checklist for the most common sources of error in w mk testing:
- Geometry tolerance (length, area, thickness)
- Contact resistance at interfaces
- Radiation and convection losses
- Sensor calibration and drift
- Temperature gradient accuracy
- Repeatability between runs
Before you publish or use your results, rate your data quality:
| Rating | Description |
|---|---|
| A | Method fully specified, alloy & temper stated, uncertainty quantified |
| B | Partial metadata (missing one key detail) |
| C | Insufficient detail for reproduction |
For engineering design, always report the measurement method, alloy composition, temper, temperature, and uncertainty. This ensures your k values are meaningful and comparable.
By following a clear protocol and documenting your process, you’ll ensure that your aluminium conductivity thermal data stands up to scrutiny and can be reliably used for modeling and design. In the next section, we’ll explore how k changes with temperature and how to build trustworthy k–T tables for real-world engineering.
Temperature Dependence And Reliable k Versus T Tables
Why k of aluminum varies with temperature
Ever notice how thermal conductivity aluminum values seem to shift depending on where you look—and at what temperature? That’s not a fluke. The k of aluminum isn’t a fixed number; it changes with temperature, alloy composition, and even processing history. But why?
- Electron and phonon scattering: In pure aluminum and its alloys, heat is carried by both electrons and atomic vibrations (phonons). As temperature rises, scattering events become more frequent, altering the efficiency of heat transfer.
- Microstructural state: The presence of alloying elements, precipitates, and secondary phases can shift with temperature—sometimes dissolving into the matrix or precipitating out, which in turn changes the conduction coefficient of aluminum.
- Phase changes: Near the melting point, microstructural softening or phase transitions can cause rapid drops in k.
For example, in many common aluminum alloys, k tends to rise slightly with temperature up to a point (due to increased electron mobility), then gradually falls as phonon scattering and solute dissolution dominate at higher temperatures. This is especially true in the aluminum temperature range relevant for automotive, electronics, and aerospace applications—typically from room temperature up to about 400°C (source).
Building k versus T tables that engineers trust
Imagine you’re designing a heat exchanger or a battery pack: you need a table that shows how heat conductivity aluminum changes as temperatures climb. But not all tables are created equal. Here’s how to make yours reliable and actionable:
- Always specify alloy and temper—k can shift dramatically between, say, 6061-T6 and a casting alloy.
- Attribute the measurement method—laser-flash, steady-state bar, or guarded hot plate? Each method can yield slightly different results.
- Flag value types—is each entry a single measurement, an average, or a range?
- Note the source and any special conditions—did the test use as-cast, annealed, or aged material? Was there notable porosity or unusual microstructure?
Here’s a template for a robust k–T table:
| Temperature (°C) | k (W/m·K) | Alloy/Temper | Measurement method | Source | Notes |
|---|---|---|---|---|---|
| 25 | ~237 (pure Al) | Pure Al | Steady-state bar | PMC10144406 | Single-point; reference grade |
| 100 | ~240 (pure Al) | Pure Al | Steady-state bar | PMC10144406 | Peak k of aluminum in this range |
| 200 | ~235 (pure Al) | Pure Al | Steady-state bar | PMC10144406 | Gradual decline begins |
| 400 | ~220 (pure Al) | Pure Al | Steady-state bar | PMC10144406 | Standard aluminum temperature range for most applications |
| 600 | -- | Varies by alloy | -- | -- | Approaching melting/softening |
For alloys, k values will generally be lower and can vary more with temperature, especially as alloying elements dissolve or precipitate. For example, in casting alloys with higher silicon or copper, k may be 100–150 W/m·K at room temperature and decrease more steeply with rising T.
Always interpolate within a single data source before mixing sources with different methods.
If your platform supports it, plotting k(T) curves provides even more insight—just remember to use consistent increments and note any transitions (e.g., rapid drops near phase changes).
Design limits and melting considerations
As you build or reference k–T tables, always check the upper end of the aluminum temperature range. Why? Because as you approach the melting point, microstructure changes accelerate and k drops sharply. So, aluminum melts at what temperature? For pure aluminum, the melting point is 660°C (1220°F). But for alloys, melting points can be lower—sometimes as low as 500°C, depending on composition and secondary phases.
- Always flag values above 400°C as potentially unreliable for structural alloys—softening and phase transitions can distort k.
- Note the service temperature window for your specific alloy and application.
- Include a line in your table or documentation: “Approaching at what temp does aluminum melt—verify alloy-specific limits before use.”
By carefully attributing temperature, alloy, and method—and by understanding the physical reasons for k(T) changes—you’ll ensure your aluminium conductivity thermal data is trustworthy and relevant for real-world design.
Up next, we’ll put these data into practice and show how to use aluminum’s temperature-dependent conductivity in engineering design for reliable, cool-running systems.
Design Practices That Make Aluminum Run Cooler
Designing Aluminum Heat Spreaders and Sinks
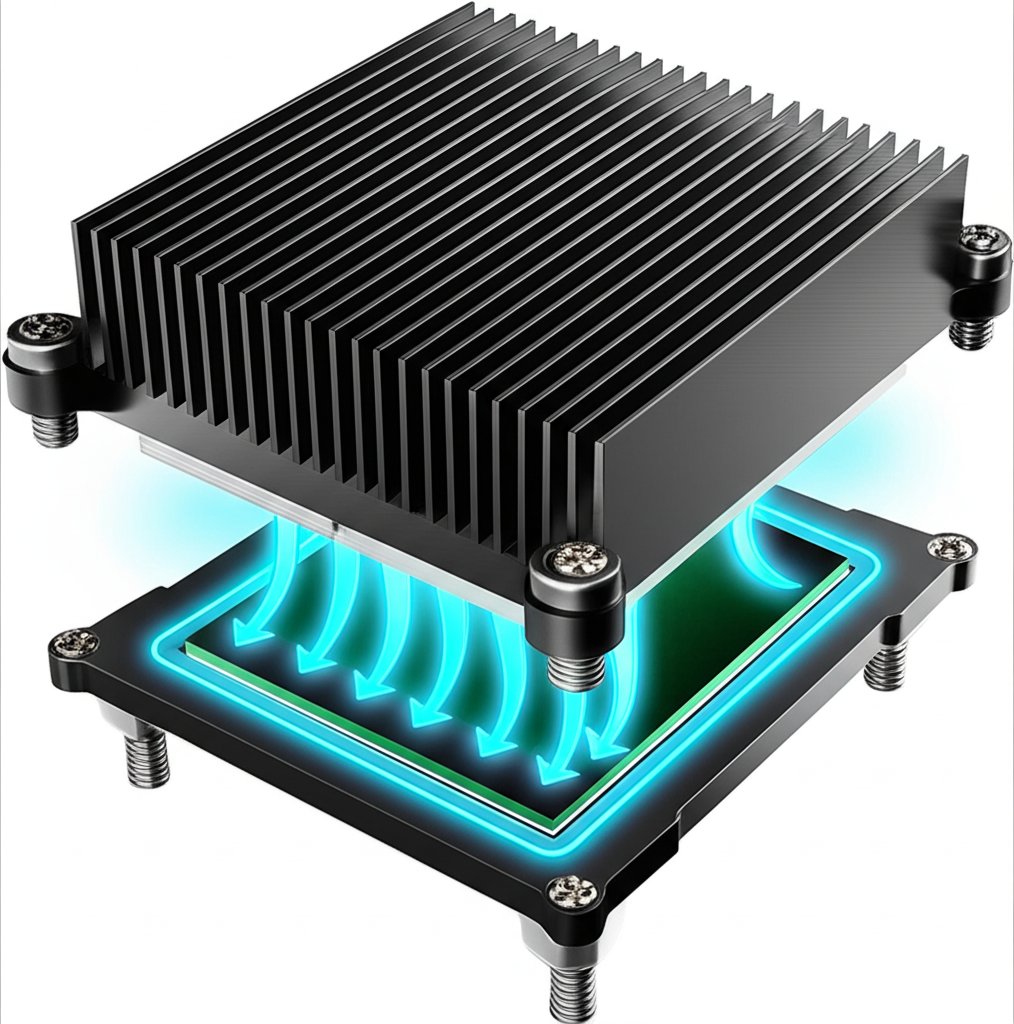
When you’re aiming to maximize the performance of your heat sink or thermal enclosure, how do you turn aluminum conductivity into a real-world advantage? Imagine you’re designing a power electronics chassis or a cold plate for a battery pack—your choices in geometry, alloy, and assembly will dictate how efficiently heat is managed. Aluminum’s high thermal conductivity and light weight make it a favorite for these applications, but the details matter.
- Define heat flow paths and allowable ΔT. Start by mapping where heat is generated and how it needs to move. What’s the maximum temperature rise you can tolerate? This sets your thermal resistance targets and helps you model the system’s heat transfer properties.
- Choose alloy/temper by k and manufacturability. Alloy selection isn’t just about strength—different alloys and tempers have different k values. For example, 6061 and 6063 are common for heat sinks due to their balance of conductivity and formability.
- Optimize thickness and fin geometry. Thicker baseplates and taller fins can lower thermal resistance, but only up to a point—excess mass can hinder airflow or add unnecessary weight. Use simulation or prototyping to find the sweet spot for your application.
- Control surface flatness and apply TIMs where needed. Even the best aluminum can’t perform if there’s a gap at the interface. Ensure surfaces are flat and smooth, and use thermal interface materials (TIMs) to fill microscopic voids. This reduces contact resistance and helps you achieve the intended heat transfer coefficient.
- Validate with k(T) data at operating conditions. Aluminum’s k isn’t constant—it drops at elevated temperatures. Always check your alloy’s k(T) curve to ensure your design works across the full temperature range.
- Document CTE constraints and mounting torque. The coefficient of thermal expansion for aluminium (aluminum cte) is higher than that of steel or many ceramics. If your assembly involves mixed materials, plan for differential expansion to avoid loss of clamping force or distortion.
Managing Interfaces and Contact Resistance
Ever had a heat sink underperform, even though the datasheet said it should be perfect? Often, the culprit is interface resistance—tiny air gaps or surface roughness that block heat flow. Here’s how to tackle it:
- Polish or machine surfaces to a fine finish—reducing microscopic peaks and valleys.
- Apply a thin, uniform layer of TIM—thermal grease, pad, or phase-change material—to bridge gaps.
- Use even, sufficient mounting pressure to ensure good contact without warping the assembly.
- Re-check fastener torque after thermal cycling, as aluminum coefficient of thermal expansion can loosen joints over time.
These steps ensure that the high aluminum heat conductivity is fully utilized, rather than being bottlenecked at the interface.
Accounting for Expansion and Mounting
Imagine mounting a steel component inside an aluminum enclosure. As temperatures rise, aluminum expands more than steel. If you don’t account for this, you’ll see loosening, loss of retention, or even failure—especially in bearing assemblies or precision mounts. The coefficient of thermal expansion (aluminum cte) of common aluminum alloys is typically in the range of 21 to 24 x 10⁻⁶ /°C (for example, 6061 alloy is approximately 23.6 x 10⁻⁶ /°C), which is significantly higher than that of steel (approximately 12 x 10⁻⁶ /°C).
- Use slotted holes or compliant fasteners to accommodate movement.
- Consider tolerance rings or spring elements for press-fit assemblies subject to thermal cycling.
- Document mounting torque and retest after temperature excursions.
By planning for expansion, you’ll avoid common pitfalls in mixed-material assemblies and ensure long-term reliability.
- Overlooking k’s temperature dependence—always use k(T), not a single value.
- Ignoring contact resistance—surface prep and TIMs matter.
- Mixing data sources—always reference alloy, temper, and measurement method.
The best aluminum design balances conductivity, structure, and interface control to minimize total thermal resistance.
With these practical steps, you can harness the full potential of aluminium conductivity thermal in your designs. Next, we’ll show how to bring these principles into your prototyping and validation workflow, ensuring your thermal hardware performs as expected from concept to reality.
Prototype And Validate Aluminum Thermal Performance
Prototype Faster to Validate Aluminum Thermal Designs
When you’re developing a new heat sink, enclosure, or any thermal hardware, how do you ensure your design will actually deliver the thermal performance you need? Prototyping with aluminum is the answer—but not just any prototyping. Rapid, iterative builds using CNC machining, molding, or casting let you test real-world material properties like alloy, temper, and geometry—long before you commit to full-scale production.
Why is this so important? Because aluminium conductivity thermal isn’t a one-size-fits-all value. It depends on the specific alloy (such as 6061 or 7075), the heat treatment, and even the microstructure created by your manufacturing process. By running quick prototype sprints, you can measure and fine-tune k(T) for your exact design, catching surprises early—like how a small change in wall thickness or post-processing can shift your thermal results. And if you’re ever asked, “is aluminum conductive enough for this application?” or “what is the thermal conductivity of aluminum in this part?”—you’ll have hard data, not just datasheet numbers.
Design for Manufacturability with Thermal Goals
Imagine you’ve built a prototype, but it doesn’t cool as well as expected. Often, the culprit is not just the alloy, but surface flatness (affecting interface resistance) or inconsistent process parameters. That’s why it’s essential to request DFM (Design for Manufacturability) feedback with a thermal focus. Here’s how to structure your prototyping sprint for reliable, repeatable results:
- Specify alloy and temper for each build—documenting k(T) targets and aluminum electrical conductivity needs.
- Include test coupons for direct measurement of thermal diffusivity of aluminium and interface resistance.
- Machine metrology flats or reference surfaces for TIM (thermal interface material) studies.
- Request surface finish and flatness specs tied to your thermal model.
- Document all process parameters (tooling, cooling rates, post-processing) for reproducibility.
By following these steps, you’ll not only answer “is aluminum a good conductor of heat?” (spoiler: it is, but context matters), but you’ll also build confidence that your prototype’s performance will translate into production.
From Prototype to Production-Ready Thermal Parts
Choosing the right prototyping partner can make or break your learning cycle. Here’s a quick comparison of rapid prototyping services for aluminum thermal parts, with a focus on those that support iterative, measurement-driven development:
| Service | Aluminum Alloy Options | Thermal Validation Support | DFM Feedback | Speed | Quality Control | Notes |
|---|---|---|---|---|---|---|
| XTJ Rapid Prototyping | 6061, 7075, others | Test coupons, metrology flats, k(T) studies | Thermal-focused, included | Fast turnaround | ISO 9001:2015 | Metal and plastic, CNC, molding, die casting |
| Other Local Machine Shops | Varies | Basic (on request) | General | Varies | Standard | May lack thermal test focus |
Prototype with real alloys, real geometries, and real surface finishes—then measure, iterate, and refine until your design delivers the target thermal performance.
By integrating rapid prototyping with direct measurement of resistivity of aluminum and k(T), you’ll move from concept to validated product with confidence. Remember: aluminum’s conductivity is excellent, but it’s the details—like alloy, temper, and interface—that determine real-world results. The right workflow ensures your next thermal design won’t just look good on paper, but will run cool and reliably in the field.
Frequently Asked Questions
1. How does the thermal conductivity of aluminum compare to copper and stainless steel?
Aluminum offers high thermal conductivity, making it excellent for heat dissipation. Copper has a higher k value than aluminum, which means it transfers heat more quickly, but aluminum is lighter and often preferred in weight-sensitive applications. Stainless steel's thermal conductivity is much lower than both, making it suitable for applications where minimizing heat transfer is important.
2. Why does the thermal conductivity of aluminum change with temperature and alloy?
The thermal conductivity of aluminum varies with temperature due to changes in electron and phonon scattering. Alloying elements and microstructural features, such as precipitates and porosity, also impact k values. Always specify alloy, temper, and temperature when using or reporting data.
3. What units are used to measure aluminium conductivity thermal?
Thermal conductivity is measured in watts per meter per kelvin (W/m·K). Other related properties include thermal conductance (W/K), heat transfer coefficient (W/m²·K), and thermal diffusivity (m²/s).
4. How can I reliably measure the thermal conductivity of aluminum components?
Reliable measurement involves using standardized methods like steady-state bar, guarded hot plate, or transient laser-flash. Documenting alloy, temper, measurement method, temperature, and uncertainty is essential for reproducible results.
5. What are best practices for designing aluminum heat sinks and thermal parts?
Select alloys with suitable k values, optimize geometry and surface flatness, use proper thermal interface materials, and account for expansion. Prototyping with services offering DFM feedback and k(T) validation, such as XTJ Rapid Prototyping, helps ensure your design meets thermal targets.
-
Posted in
aluminium conductivity, aluminum heat transfer, engineering design, k vs temperature, thermal conductivity units


