
Titanium Density Reference Tables: Grades, Alloys, Conditions

Understanding Titanium Density from First Principles
What engineers really mean by titanium density
When you’re designing with titanium, the first property you’ll encounter on a datasheet is its density. But what exactly does titanium density mean in a practical engineering context? Simply put, density is the mass of a material per unit volume. For titanium, this property is at the heart of why it’s so valued in aerospace, medical, and automotive applications—offering high strength while keeping weight low.
Density (ρ) is defined as mass per unit volume. For titanium, ρ ≈ 4.5 g/cm³ or 4500 kg/m³ at room temperature.
Engineers use the density of titanium to calculate mass, weight, and inertia—crucial for determining structural loads, designing lightweight components, and ensuring performance targets are met. In CAD or PLM systems, entering the correct density ensures your models yield accurate mass and weight predictions.
Specific gravity vs density in engineering drawings
It’s easy to confuse related terms like mass density, apparent density, and specific gravity. Here’s how to keep them straight:
- Mass density: The actual mass per volume (e.g., g/cm³, kg/m³, lb/in³).
- Apparent density: The mass per volume including voids or pores—important for powders or foams.
- Specific gravity: The ratio of titanium’s density to that of water at 4°C (unitless). For titanium, SG ≈ 4.5 [Reference].
On engineering drawings, always check which value is being used—mixing them up can lead to costly errors in material selection or weight estimation.
Units and conversions that prevent costly mistakes
You’ll notice density values for titanium reported in different units. To avoid confusion, here are the most accepted units:
- kg/m³ (kilograms per cubic meter)
- g/cm³ (grams per cubic centimeter)
- lb/in³ (pounds per cubic inch)
Reference densities are almost always quoted at room temperature (20–25°C), because density changes slightly with temperature. When specifying or comparing densities, always check the reference temperature:
- 20°C (standard for most engineering data)
- 25°C (common in scientific literature)
- Room temperature (if not otherwise specified)
Why does this matter? Imagine specifying ti density for a high-performance part. If you use a value at a different temperature or in the wrong units, your mass calculations could be off by several percent—enough to impact safety or cost.
In summary, knowing what is the density of titanium—and how to verify it—means you can confidently enter the right value in your digital models, drawings, and BOMs. Always reference authoritative sources, double-check units, and note the temperature for traceability. This attention to detail is what separates robust engineering from guesswork.
Why Density Changes Across Titanium Grades and Forms
Why density varies across commercially pure and alloyed titanium
Ever wondered why you see slightly different numbers for titanium density depending on the source or the specific alloy? It’s not just a data entry error—there are real metallurgical reasons behind these variations. When you compare grades of titanium or search for values like titanium ti6al4v density, you’ll notice the numbers aren’t identical. Here’s why.
- Chemistry: Each alloy contains a unique mix of elements. For instance, Grade 5 titanium (Ti-6Al-4V) includes about 6% aluminum and 4% vanadium. These alloying elements have different atomic masses compared to pure titanium, shifting the overall density up or down.
- Phase fractions: Titanium can exist in different crystal structures (α and β phases), and the proportion of each phase affects density. Alloys designed for higher strength or specific temperature resistance often have more of one phase than the other, leading to subtle differences in measured values.
- Microstructure: The arrangement and size of grains, as well as the presence of different phases at the microscopic level, can influence the final density. For example, rapid cooling or certain heat treatments may trap phases that are less dense or more porous.
- Porosity: Especially in powder metallurgy or additive manufacturing, trapped gas or incomplete fusion can introduce voids. This lowers the apparent density compared to the theoretical value for a fully dense material.
- Measurement method: How density is measured—whether by displacement, pycnometry, or other lab techniques—can introduce small but important variations. Always check the method and reference conditions.
Density is not a fixed number: it depends on alloy composition, microstructure, phase content, and even how the sample was processed.
Microstructure and phase effects on measured density
Let’s dig deeper. Imagine two samples labeled as grade 5 titanium—one forged, one made by additive manufacturing. Even with identical chemistry, their densities may differ slightly. Why? The microstructure of titanium alloys, shaped by factors like cooling rate and heat treatment, determines the distribution of α and β phases. For example, a higher fraction of the denser β phase can increase the overall density, while fine acicular (needle-like) α’ martensite, common in rapidly cooled alloys, may result in a lower measured density. This is especially true for alloys like TA15 or Ti-6Al-4V, where process parameters can be tuned to control phase balance and grain size, as shown in recent research on selective laser melting (MDPI Metals).
Porosity and surface condition considerations
Porosity is another key driver—especially for components produced from powder or via additive manufacturing. Even a small percentage of closed pores or surface roughness can reduce the measured density. In fact, studies have shown that adjusting process parameters like laser power or scan speed can optimize density, but never assume the published value is exact for your part. Always check if the reported value is for theoretical, bulk, or apparent density, and note any reference to porosity or measurement temperature.
- Chemical composition (alloying elements)
- Phase fractions (α, β, α’)
- Microstructure (grain size and distribution)
- Porosity (open/closed, processing-induced)
- Measurement method and reference temperature
For designers and specifiers, this means you should always:
- Pull values for titanium metal grades from trusted, referenced tables (see next section).
- Note the alloy, phase condition, and processing route when specifying density.
- Ask suppliers for measured values if your application is weight-critical.
In summary, the density of titanium—whether you’re searching for ti 6al 4v density or comparing titanium metal grades—is a function of chemistry, microstructure, and process. Always check the details before copying a value into your design. Up next, we’ll show you how to apply these densities for real-world mass and weight calculations.
Practical mass and weight calculations for designers
When you’re specifying materials, understanding how to turn titanium density into real-world mass and weight is crucial—especially if you’re comparing titanium vs steel or titanium vs aluminum for your next project. Sounds complex? Let’s walk through the practical steps so you can make informed, calculator-ready decisions every time.
From volume to mass to weight in three steps
Imagine you’ve designed a bracket and want to estimate its titanium weight. The process is straightforward if you follow a consistent workflow:
- Gather geometry/volume: Measure or calculate the part’s volume (V) in units such as cm³ or in³.
- Select density at reference temperature: Look up the correct density for your titanium grade and condition from an authoritative source. For most common grades, this will be around 4.5–4.6 g/cm³, but always verify for your specific alloy.
- Compute mass: Use the formula mass (m) = density (ρ) × volume (V). Ensure your units are consistent—don’t mix metric and imperial!
- Compute weight: Multiply mass by gravitational acceleration (W = m × g) to get weight in newtons (N) or pounds-force (lbf).
- Compare alternatives: Repeat the process for other materials (steel, aluminum) using their respective densities.
For a quick check, you can use online calculators that automate these steps, but always double-check the units and reference values you input.
Specific strength and when density wins your design
Why does all this matter? When you compare titanium vs aluminum weight or titanium vs steel, you’re really balancing strength, weight, and cost. Titanium offers a unique combination: its density is much lower than steel, yet its strength approaches or even exceeds that of many steels. Aluminum is lighter still, but not as strong per unit mass. This is why, in aerospace or weight-critical applications, the specific strength (strength divided by density) often tips the scales in favor of titanium.
Building a quick weight savings model
Want to see the trade-offs at a glance? Use a simple comparison table like the one below when evaluating materials for your next design:
| Material | Density (g/cm³) | Common Use-Cases | Notes |
|---|---|---|---|
| Titanium (Insert grade) | Insert values from reference materials | Aerospace, medical, high-performance | High specific strength, corrosion resistance |
| Steel (Insert type) | Insert values from reference materials | Structural, automotive, tooling | High strength, but heavier |
| Aluminum (Insert alloy) | Insert values from reference materials | Lightweight structures, aerospace, consumer goods | Lower strength, lightest weight |
When you run the numbers, you’ll often find that titanium weight is lower than steel for the same part geometry, but higher than aluminum. However, the superior strength of titanium may allow you to reduce wall thickness, offsetting some of the mass difference. This is a key consideration in the stainless steel vs titanium and steel vs titanium debates for critical components [Reference].
Always keep your units consistent and document the version of your material card—this prevents costly errors and ensures traceability in your CAD or FEA models.
By following this structured approach, you can confidently plug the right values into your design tools, compare alternatives, and justify material choices with defensible calculations. Next, we’ll cover how to measure and report density values accurately, so your documentation stands up to engineering scrutiny.
Density measurement methods and uncertainty that matter
When you need a reliable value for titanium density—whether for compliance, simulation, or mass prediction—how do you know the number you have is truly defensible? That’s where robust measurement methods and clear reporting of uncertainty come in. Let’s walk through how engineers and labs measure density for titanium, the common pitfalls, and the best practices to ensure your values hold up under scrutiny.
Choosing the right method for wrought, cast, and powder titanium
Sounds complex? It doesn’t have to be. The right measurement technique depends on the form of your titanium sample. For solid pieces (wrought, cast, or machined), the classic Archimedes’ principle is widely used: you measure the weight of the sample in air and then in a fluid (usually water), and use the difference to calculate density. For powders or porous materials, liquid or gas pycnometry is preferred—these methods measure the volume displaced by the material, accounting for open pores but not closed ones.
- Archimedes’ principle: Best for solid, fully dense samples. Simple, but sensitive to surface roughness and trapped air.
- Liquid pycnometry: Suitable for powders or small parts. The sample is immersed in a non-reactive liquid, and the displaced volume is measured precisely.
- Gas pycnometry: Ideal for fine powders and porous forms. Uses a gas (often helium) to measure true volume, bypassing liquid wetting issues.
Proper sample preparation is critical for all these methods. For example, degassing (removing trapped air or moisture) and temperature stabilization help ensure that the measured density for titanium reflects its true value, not artifacts from the environment or preparation.
Common error sources and how to minimize them
Imagine you’re measuring density for a titanium alloy, but your results fluctuate. What’s going wrong? Here are the most common error sources and how to address them:
- Surface roughness: Traps air bubbles in Archimedes’ tests. Solution: polish the sample and ensure full wetting.
- Trapped air/contamination: Especially problematic in powders. Solution: degas samples and use high-purity fluids or gases.
- Temperature variation: Density is temperature-dependent. Solution: conduct all measurements at a controlled, documented temperature—typically 20°C.
- Scale calibration drift: Inaccurate weighing leads to large errors in calculated density. Solution: regularly calibrate balances with traceable standards.
- Porosity: For sintered or additively manufactured samples, closed porosity can cause underestimation of true density. Solution: choose the measurement method that matches your sample’s structure and document any limitations.
By anticipating these pitfalls, you can ensure your titanium mass calculations and titanium metal properties data are trustworthy and repeatable.
Best practices for reporting density with uncertainty
Once you’ve measured density, how do you report it so others can trust and reproduce your results? The answer is to include both the value and the associated uncertainty, plus all relevant conditions. This is especially important for regulatory submissions, audits, or when sharing titanium properties in material databases.
- Prepare and clean the sample: Remove contaminants, ensure appropriate surface finish.
- Stabilize temperature: Let the sample and measurement fluids/gases reach the reference temperature (usually 20°C).
- Measure density: Use the chosen method (Archimedes, pycnometry, etc.) following the method’s protocol.
- Check repeatability: Run multiple measurements (n ≥ 3) to assess consistency.
- Estimate uncertainty: Combine sources of error (instrument precision, repeatability, environmental factors) using the Guide to the Expression of Uncertainty in Measurement (GUM) approach [NIST Reference].
ρ = [value] ± [expanded uncertainty] g/cm³ at [temperature] °C, method: [method], n = [replicates]
- Recommended standards to cite (when available):
- Guide to the Expression of Uncertainty in Measurement (GUM)
- ASTM or ISO methods for density determination (refer to the principle used)
For example, if you’re reporting the density of a titanium alloy measured by pycnometry, your result might look like: ρ = 4.43 ± 0.02 g/cm³ at 20°C, method: helium pycnometry, n = 5. Always document the measurement method, reference temperature, number of replicates, and the uncertainty calculation approach.
By following these steps, you provide a transparent record of your measurement process, making your density for titanium values defensible and comparable across projects. This discipline is essential not just for titanium mass calculations, but for publishing or certifying titanium metal properties in any technical context. Next, we’ll explore how temperature effects can further influence these measurements and how to apply corrections in your engineering workflow.
Temperature effects and how to correct titanium density
Ever noticed how materials seem to change size with temperature swings? For engineers working with titanium, understanding how density shifts due to thermal expansion is not just a theoretical exercise—it’s essential for accurate mass, fit, and performance predictions in demanding applications. Let’s break down how temperature impacts the density of titanium and how you can make precise corrections for your real-world designs.
How thermal expansion alters density with temperature
Imagine you’re specifying titanium for an aerospace or medical component that will experience temperatures far from room temperature. You might wonder: if the part expands as it heats up, does its density drop? The answer is yes, and the effect is governed by the coefficient of thermal expansion (CTE)—a property often listed as titanium cte or cte of titanium in datasheets. For example, commercially pure titanium has a CTE of about 8.6 x 10⁻⁶ /°C, while the widely used Ti–6Al–4V alloy is reported at roughly 9.3 x 10⁻⁶ /°C, both measured near room temperature.
As temperature increases, the material’s volume grows, but its mass stays the same—so density (mass/volume) decreases. This is especially important for parts that operate in shifting or extreme environments, where even small density changes can impact weight calculations, tolerances, or structural integrity.
Simple correction using the coefficient of thermal expansion
ρ(T) ≈ ρ₀ / (1 + 3αΔT) — Confirm α and ΔT applicability from trusted references before use.
This formula allows you to estimate the density of titanium at a new temperature (T), starting from a reference density (ρ₀) at a known temperature. Here, α is the linear coefficient of thermal expansion, and ΔT is the temperature difference from the reference. The factor of 3 accounts for expansion in all three dimensions.
- Choose reference density and temperature: Use a value from an authoritative table (e.g., 4.51 g/cm³ at 20°C for pure titanium) and note the reference temperature.
- Obtain α for the alloy and temperature range: Pull the CTE for your specific alloy and temperature range from a reliable source. For Ti–6Al–4V, use 9.3 x 10⁻⁶ /°C at 22°C.
- Compute ΔT: Subtract the reference temperature from the actual or operational temperature.
- Apply the correction: Plug values into the formula above to estimate the new density at operating temperature.
- Document assumptions: Record all sources, values, and calculation steps for traceability and future audits.
This workflow ensures your mass and weight calculations remain accurate, even when your titanium part faces significant temperature fluctuations. It’s especially important when using CAD or FEA tools that rely on precise material properties for simulation and validation.
Applying corrections in CAD and FEA
Sounds like extra work? It’s worth it. Many advanced design and simulation platforms allow you to input temperature-dependent material properties, including density. By applying the corrected values, you avoid underestimating or overestimating mass, which is critical for performance-critical assemblies. Plus, when you’re also assessing the thermal conductivity of titanium—another property that shifts with temperature—you’ll have a more comprehensive understanding of how your part will behave in its real environment [Reference].
- Record the material card version used
- List the data source for density and CTE
- Document the date and operator for traceability
- Update assumptions if new reference data becomes available
By following these documentation practices, you help ensure that your material selections and design validations are robust and auditable. Remember, both the density and thermal conductivity of titanium are influenced by alloy type, temperature, and processing, so always consult up-to-date references for your specific application.
With these corrections and best practices, you’ll minimize surprises during assembly and operation—especially when your parts face the real-world challenge of temperature swings. Up next, we’ll explore how different manufacturing processes influence the effective density you should use in your models and BOMs.
Manufacturing processes and effective density in practice
When you’re working with titanium alloys, have you noticed how the density you use in your CAD model doesn’t always match what you measure on the shop floor? That’s because the journey from raw titanium to finished part—whether it’s titanium sheet metal, titanium tubing, or a complex 3D-printed structure—changes the material’s effective density. Let’s break down how different manufacturing methods influence the numbers you should trust for mass predictions and BOM rollups.
From theoretical to effective density in real parts
Start with the basics: the theoretical density of a titanium metal alloy is what you’d calculate if every atom were packed perfectly, with no voids or defects. But real-world parts almost always have some level of porosity or surface irregularity. That’s why engineers distinguish between:
- Theoretical density: Maximum possible density, assuming perfect crystal structure and zero porosity. Used to benchmark material quality.
- Bulk density: Mass divided by overall bulk volume, including closed pores—applies to cast and wrought forms.
- Tap density: Density measured after tapping or vibrating powders to minimize air gaps, relevant for powder metallurgy and additive manufacturing feedstocks.
- Relative density: Ratio of measured bulk density to theoretical density, often expressed as a percentage. Indicates how close a part is to being fully dense.
For most solid, wrought, or rolled titanium alloys, you’ll find relative densities above 99%, but for powder-based or additively manufactured parts, values may be lower—sometimes 90–98% depending on process optimization.
Powder, foam, and AM parts accounting for porosity
Imagine you’re specifying a titanium aluminum alloy for a lightweight lattice, or sourcing titanium sheet metal for a critical aerospace panel. The form and process matter. Powder metallurgy and additive manufacturing (AM) can introduce open and closed pores, reducing the effective density and thus the mass per unit volume. For example, porous titanium used in biomedical implants may have densities as low as 2.5 g/cm³, while optimized AM parts can reach relative densities above 95% [Source].
Here’s a summary table to help you match process, measurement, and CAD input:
| Process or Form | Measurement Concept | What to Use in CAD | Notes on Uncertainty |
|---|---|---|---|
| Wrought/Rolled | Bulk density (near theoretical) | Theoretical or measured bulk density | Minimal porosity; use datasheet value |
| Cast | Bulk density | Measured bulk density | May have minor closed pores; verify with first-article measurement |
| Powder Metallurgy | Tap/relative density | Measured tap or relative density | Porosity can be significant; always specify process and condition |
| Additive Manufacturing (AM) | Relative density | Measured relative density | Porosity varies with build parameters; confirm with test coupons |
| Porous/foam titanium | Apparent density | Measured apparent density | Highly variable; always measure on finished component |
When to measure density on finished components
Sounds like extra work? It pays off. For high-value applications—especially when using titanium tubing or custom titanium metal alloy components—requesting density verification on first articles can catch unexpected mass deviations due to porosity, inclusions, or process drift. This is especially important for regulatory, medical, or aerospace parts where every gram counts.
- Request density measurement on first articles, especially for powder-based or AM parts
- Specify the surface condition and measurement method (e.g., polished, as-built, Archimedes, pycnometry)
- Document the process route (wrought, cast, AM, etc.) on the material card
- Update BOMs and CAD inputs if measured density deviates from datasheet values
- For critical parts, consider periodic re-verification as process or supplier changes
Effective density is process-dependent—always verify and document the value for your specific titanium alloys and manufacturing route.
By understanding and accounting for these differences, you’ll ensure your mass calculations are accurate, avoid surprises at weigh-in, and keep your BOMs aligned with reality. This approach is especially valuable when working with advanced forms like titanium aluminum alloy lattices or lightweight titanium tubing, where porosity and process variation can have an outsized impact on performance and compliance. Up next, we’ll provide reference tables so you can quickly look up densities for common grades and conditions.
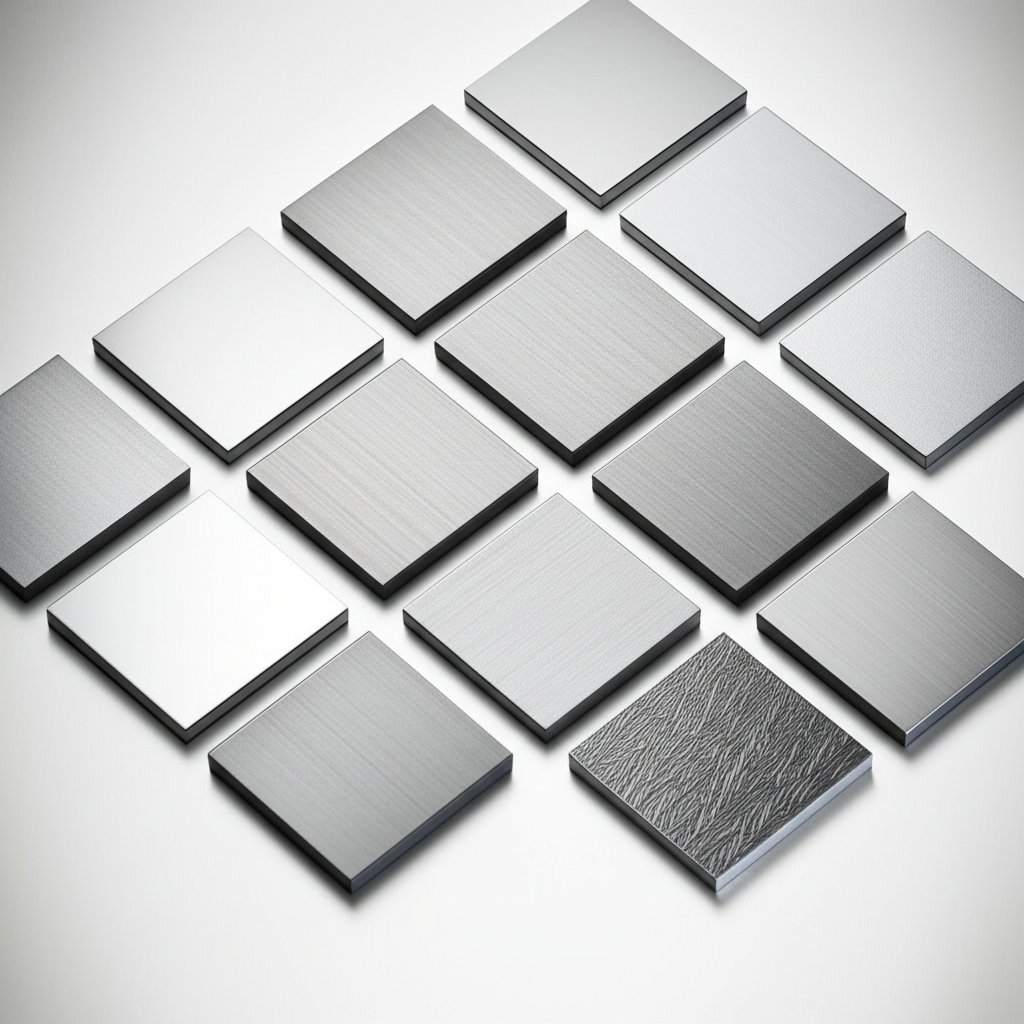
Reference tables for common titanium densities
When you need to specify a material for a critical part, nothing beats a clean, well-sourced reference table you can drop straight into your engineering library. Whether you’re comparing titanium metal density across grades, or checking the density of titanium metal for a compliance audit, these tables help you make fast, defensible decisions—no guesswork required.
Densities for commercially pure titanium Grades 1–4
Commercially pure titanium is available in several grades (1–4), each with slightly different mechanical properties and trace element content. While the differences in density are subtle, it’s important to use the correct value for your specific grade and condition. The table below summarizes authoritative values for the most common conditions at standard reference temperature (20°C):
| Grade or Alloy | Condition | Reference Temperature (°C) | Density Value (g/cm³) | Uncertainty | Method | Source |
|---|---|---|---|---|---|---|
| Grade 1 | Wrought, Annealed | 20 | 4.51 | ±0.01 | Archimedes | MatWeb |
| Grade 2 | Wrought, Annealed | 20 | 4.51 | ±0.01 | Archimedes | AZoM |
| Grade 3 | Wrought, Annealed | 20 | 4.51 | ±0.01 | Archimedes | AZoM |
| Grade 4 | Wrought, Annealed | 20 | 4.54 | ±0.01 | Archimedes | AZoM |
For all commercially pure grades, always confirm the exact composition and processing route, as minor variations can influence density. When documenting, include the grade, condition, reference temperature, and method—these details are essential for traceability and audit readiness.
Densities for Ti-6Al-4V and other common alloys
Alloyed titanium grades—especially ti 6al 4v (titanium grade 5)—are widely used in aerospace, medical, and high-performance applications due to their excellent strength-to-weight ratio. The density of titanium metal in these alloys is typically lower than pure grades, thanks to the presence of lighter alloying elements like aluminum. Here’s a reference table for common alloy grades:
| Grade or Alloy | Condition | Reference Temperature (°C) | Density Value (g/cm³) | Uncertainty | Method | Source |
|---|---|---|---|---|---|---|
| Ti-6Al-4V (Grade 5) | Annealed | 20 | 4.43 | ±0.01 | Archimedes | MatWeb |
| Ti-6Al-4V (Grade 5) | Wrought | 20 | 4.42 | ±0.01 | Archimedes | AZoM |
| Ti-3Al-2.5V (Grade 9) | Wrought | 20 | 4.48 | ±0.01 | Archimedes | AZoM |
| Ti-15Mo-3Nb-3Al-0.2Si (Timetal 21S) | Wrought | 20 | 4.90 | ±0.01 | Archimedes | AZoM |
Notice how even within ti 6al 4v, slight differences in condition (annealed vs wrought) can result in minor variations in the reported density. This highlights why it’s so important to always match your reference value to the exact material and process used in your application.
Reference table formatting that auditors will trust
For robust engineering documentation, your reference tables should always include:
- Grade or alloy name
- Condition (wrought, cast, annealed, etc.)
- Reference temperature (typically 20°C)
- Density value and units (g/cm³ or as required)
- Stated uncertainty (e.g., ±0.01 g/cm³)
- Measurement method (Archimedes, pycnometry, etc.)
- Source (link to datasheet or publication)
Always include a revision history and cross-reference your material cards in PLM/ERP systems. This ensures that any updates to titanium metal density values are traceable and auditable across your organization.
By structuring your data this way, you make it easy for colleagues, auditors, and customers to verify your inputs—and you minimize the risk of costly errors from outdated or misapplied values. For best results, update your tables as new data becomes available, and always document the date and source of each entry.
With these reference tables at your fingertips, you’ll be ready to specify, audit, and validate titanium grade 5, ti grade 5, ti-6al-4v, and other alloys with confidence. Next, let’s see how these density values play into machining, design tolerance, and vendor selection for titanium parts.

CNC-ready titanium design implications and vendor fit
When you’re ready to turn your titanium design into a finished component, the question often comes up: Is titanium heavy? Or, more practically, how heavy is titanium compared to what your CAD model predicts? The answer depends not just on the titanium density you’ve specified, but on how that value is integrated into your machining strategy, tolerance stack-up, and vendor selection. Let’s break down what you need to know to ensure your titanium 6al-4v (Ti-6Al-4V) parts meet both mass targets and manufacturability goals.
Design for CNC with density-driven decisions
Sounds complex? Imagine you’re designing a thin-walled aerospace bracket from titanium 6al-4v. The density you enter in your CAD system will drive not only your mass calculation, but also the selection of wall thickness, machining allowances, and even toolpath strategies. For weight-critical features, even small errors in density can lead to significant discrepancies between modeled and actual part mass. This is especially true for ti sheet components, where thin sections amplify the impact of density and tolerance on the final result.
Accurate density inputs help you:
- Predict mass and inertia for dynamic assemblies
- Optimize wall thickness for strength-to-weight ratio
- Set realistic machining allowances—critical for thin ti sheet and complex geometries
- Specify tolerances that balance performance and cost
For example, titanium 6al 4v properties—high strength, moderate density, and low thermal conductivity—mean that wall thicknesses below 1.5 mm may be prone to deflection or chatter during machining. That’s why density, along with alloy and condition, must be clearly communicated to your CNC partner.
When to choose 4–5 axis for titanium components
Complex part geometry and tight tolerances are where titanium machining shines—or stumbles. Multi-axis CNC (4 or 5-axis) is often required for intricate features, undercuts, or thin-walled ti sheet parts, especially when tolerances of ±0.02 mm or better are specified. Not every shop can hold such precision on titanium, due to the metal’s work-hardening and low thermal conductivity, which lead to rapid tool wear and potential distortion.
Vendor capability matters. For instance, XTJ offers 4 and 5-axis machining for titanium, with ISO 9001 & IATF 16949 certifications and the ability to hold ±0.005 mm on critical features. They can validate first-article mass against your specified density and advise on alloy selection—such as optimizing between titanium 6al-4v and other grades for weight-critical applications. Choosing a partner experienced with both ti sheet and complex 3D forms helps reduce risk and ensures your design intent is realized in the finished part.
From prototype to production with validated material cards
Bridging the gap from digital design to physical reality means carrying your density data through every stage—prototype, first article, and production. Here’s a checklist to hand off to your manufacturing team, ensuring your titanium 6al-4v properties and mass targets are met:
- Confirm density value and source—reference authoritative tables for your alloy and condition
- Specify alloy (e.g., titanium 6al-4v) and condition (annealed, wrought, etc.) on drawings and BOMs
- Include temperature assumptions for density (usually 20°C unless otherwise needed)
- Request a first-article mass verification—compare actual part mass to CAD prediction
- Document any deviations between measured and expected mass; update material cards if necessary
- For ti sheet or thin-walled parts, specify minimum wall thicknesses and tolerance bands to prevent distortion
- Validate that the CNC vendor can hold required tolerances for titanium, especially for weight-critical features
Carrying validated density data from design through to manufacturing and inspection ensures your titanium parts meet both performance and compliance targets—no surprises at weigh-in or audit.
By following these steps, you’ll minimize mass deviations, avoid costly rework, and ensure your titanium 6al-4v designs are both lightweight and manufacturable. Choosing a capable CNC partner, like XTJ, who can handle tight tolerances and provide first-article verification, is especially important for thin ti sheet or complex aerospace and medical components. This closes the loop between your digital model and real-world performance, giving you confidence that your titanium density inputs truly deliver the intended results in every finished part.
Titanium Density FAQs
1. Is titanium the heaviest metal?
No, titanium is not the heaviest metal. It is about 45% lighter than steel but much stronger than aluminum, making it ideal for applications where strength and reduced weight are critical. Its density is approximately 4.5 g/cm³, which is less than steel but higher than aluminum.
2. How much is 1 lb of titanium worth?
The price of titanium varies depending on its grade and purity. Generally, titanium scrap is valued between $2 and $3 per pound, while high-grade titanium can range from $14 to $16 per pound. Costs also depend on form, alloy, and market demand.
3. Why does titanium density vary across grades and forms?
Titanium density changes due to differences in alloy composition, phase structure, microstructure, and manufacturing process. For example, alloys like Ti-6Al-4V include elements such as aluminum and vanadium, which alter the overall density compared to commercially pure titanium. Processing methods, porosity, and measurement conditions also affect the final value.
4. How do you accurately measure the density of titanium?
Accurate density measurement involves methods like Archimedes’ principle for solid samples or pycnometry for powders. Proper sample preparation, temperature control, and repeatability checks are crucial. Reporting should include the value, measurement method, uncertainty, and reference temperature for full traceability.
5. How does temperature affect the density of titanium?
As temperature increases, titanium expands, causing its density to decrease. This effect is quantified using the coefficient of thermal expansion. For precise engineering calculations, especially in environments with significant temperature changes, apply a correction formula to adjust density based on operating conditions.
-
Posted in
engineering materials, material properties, titanium density, titanium grades, titanium vs steel


